What is the linux top command?
linux top — display and update sorted information about processes
Run this command to start an interactive command mode with the top half showing statistics that contain load, process, and resource usage. The bottom half shows a list of currently running processes.
Pressing q will only exit the command mode.


What is the linux top command syntax?
syntax
top -hv|-bcEHiOSs1 -d secs -n max -u|U user -p pid -o fld -w [cols]options
- -b :Batch-mode operation
Starts top in Batch mode, which could be useful for sending output from top to other programs or to a file. In this mode, top will not accept input and runs until the iterations limit you’ve set with the'-n' command-line option or until killed. -d :Delay-time interval
Specifies the delay between screen updates, and overrides the corresponding value in one's personal configuration file or the startup default. Later this can be changed with the‘d’ or ‘s’ interactive commands.- -i :Idle-process toggle
When this toggle is Off, tasks that have not used any CPU since the last update will not be displayed. - -n :Number-of-iterations limit as: -n number
Specifies the maximum number of iterations, or frames, top should produce before ending. - -o :Override-sort-field as: -o fieldname
Specifies the name of the field on which tasks will be sorted, independent of what is reflected in the configuration file. - -p :Monitor-PIDs mode as: -pN1 -pN2 … or -pN1,N2,N3 …
Monitor only processes with specified process IDs. This option can be given up to 20 times, or you can provide a comma delimited list with up to 20 pids. - -s :Secure-mode operation
Starts top with secure mode forced, even for root. - -u | -U :User-filter-mode as: -u | -U number or name
Display only processes with a user id or user name matching that given. - -1 :Single/Separate-Cpu-States toggle
Starts top with the last remembered Cpu States portion of the summary area reversed. Either all cpu information will be displayed in a single line or each cpu will be displayed separately, depending on the state of the NUMA Node command toggle (‘2’). - -H :Threads-mode operation
Instructs top to display individual threads.
Summary area commands
When the linux top command is run in the foreground, the following related keys are used to turn more functions on and off.
- A :Alternate-Display-Mode toggle
- l :Load-Average/Uptime toggle
- t :Task/Cpu-States toggle
- m :Memory/Swap-Usage toggle
- E :Extend-Memory-Scale in Summary Area
- 1 :Single/Separate-Cpu-States toggle
- 2 :NUMA-Nodes/Cpu-Summary toggle
- c :Command-Line/Program-Name toggle
- u | U :Show-Specific-User-Only
- i :Idle-Process toggle
- z :Change-Color-Mapping
- k :Kill-a-task
- ? | h :Help
- q :Quit
Summary display – What data can be displayed by the linux top command?
top half – resource usage

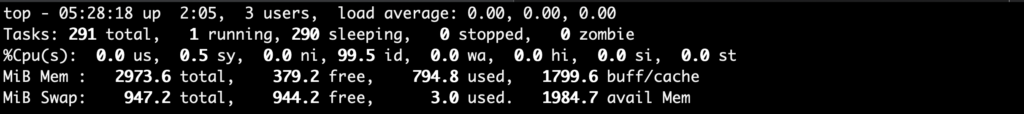
UPTIME and LOAD Averages
This portion consists of a single line containing:
current time and length of time since last boot
total number of users
system load avg over the last 1, 5 and 15 minutes
TASK and CPU States
This portion consists of a minimum of two lines. In an SMP environment, additional lines can reflect individual CPU state percentages.
* Line 1 shows total tasks or threads, depending on the state of the Threads-mode toggle.
That total is further classified as:
running; sleeping; stopped; zombie
* Line 2 shows CPU state percentages based on the interval since the last refresh.
CPU status field description:
- us, user :
time running un-niced user processes - sy, system :
time running kernel processes - ni, nice :
time running niced user processes - id, idle :
time spent in the kernel idle handler - wa, IO-wait :
time waiting for I/O completion - hi :
time spent servicing hardware interrupts - si :
time spent servicing software interrupts - st :
time stolen from this vm by the hypervisor
MEMORY Usage
This portion consists of two lines which may express values in kibibytes (KiB) through exbibytes (EiB) depending on the scaling factor enforced with the `E’ interactive command.
As a default, Line 1 reflects physical memory, classified as:
total, free, used and buff/cache
Line 2 reflects mostly virtual memory, classified as:
total, free, used and avail (which is physical memory)
bottom half – running processes


Descriptions of fields
- PID: Shows task’s unique process id.
- USER: User name of owner of task.
- PR: Stands for priority of the task.
- NI: Represents a Nice Value of task. A Negative nice value implies higher priority, and positive Nice value means lower priority.
- VIRT: Total virtual memory used by the task.
- RES: Resident Memory Size (KiB).
- SHR: Represents the Shared Memory size (kb) used by a task.
- S : Process Status. The status of the task which can be one of:
- D = uninterruptible sleep
- I = idle
- R = running
- S = sleeping
- T = stopped by job control signal
- t = stopped by debugger during trace
- Z = zombie
- %CPU: Represents the CPU usage.
- %MEM: Shows the Memory usage of task.
- TIME+: CPU Time, the same as ‘TIME’, but reflecting more granularity through hundredths of a second.
- COMMAND: Command Name or Command Line.
Top examples – How to use the linux top command?
Display Specific User Process
➜ ~ top -u ylspirit 

Display specified process information
➜ ~ top -p 652

Display thread information of the specified pid
➜ ~ top -Hp pidTerminate update display after updating 2 time
➜ ~ top -n 2Top information is updated at specified intervals
➜ ~ top -d 3 # 3 secondHighlight Running Process
Press ‘z‘ option in running top command will display running process in color which may help you to identified running process easily

Display the absolute path of the process command
Press ‘c‘ option in running top command, it will display absolute path of running process command


Display the number of CPU cores and their usage
Press “1” option in running top command, it will display the number of CPU cores and their usage.


For more explanation of the top command, please see man top.
The top command is used in some actual production:
Linux load average high, Java project
four ways to view linux load average and load explained
Awk tutorial: find and kill process use awk
Recommended Posts:
Linux common commands tutorial and use examples
GNU sed syntax and sed examples
Awk tutorial: awk syntax and awk examples
linux chmod command and linux chown command usage
linux iostat syntax and iostat examples
linux grep command and grep examples